Alexander Lorenz, featured ILCC liquid crystal artist, March 2012


A._Lorenz
Dr. Alexander Lorenz is an alumnus and postdoctoral fellow of the Research Training Group “Micro- and Nanostructures in Optoelectronics and Photonics” (DFG, GRK1464) at the University of Paderborn. In May 2010, he was awarded the Young Scientist Award of the German Liquid Crystal Society (DFKG, category: oral presentation). He finished his dissertation on ‘Switchable waveguiding in photonic liquid crystal microstructures’ in July 2010 in Heinz Kitzerow’s group. His current research interests are focused on X-ray studies of nanoparticle doped liquid crystals and electro-optic studies of doped nematic and chiral nematic liquid crystals (supported by the European Science Foundation EUROCORES, SONS II, ‘Self-organized nanostructures’).
contact_CB15_chol-mix
Induced chiral nematic LC in contact with CB15. The transmitted light optical micrograph shows an induced chiral nematic liquid crystal which was brought in contact with the pure chiral dopant CB15. On the right hand side of the image, the chiral nematic liquid crystal is seen in the Grandjean texture. On the left hand side of the image, a black region is seen, which corresponds to pure CB15. The chiral dopant has diffused into the liquid crystal, due to the concentration gradient. Thus, the concentration of CB15 increases from the right hand side of the image to the left hand side of the image. Along with the concentration of CB15, the chirality of the liquid crystal increases, too. Correspondingly, the chiral pitch decreases from the right hand side to the left hand side of the region shown in the micrograph. This leads to a continuous change of color in the cholesteric region followed by an increasing number of defects (Maltese crosses). Such Maltese crosses may upon heating be observed in short-pitch chiral nematic liquid crystals near the phase transition from the cholesteric phase to a blue phase. In the current image, a phase transition to blue phase I can be identified by a line. A broad blue-colored belt follows, where the platelet texture of blue phase I is seen, although the individual platelets cannot be distinguished. Next to this, a narrow, cyan-colored belt is seen. This second belt corresponds to blue phase II.
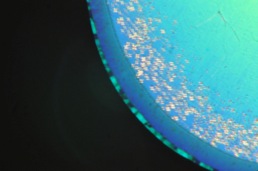
In summary, the micrograph shows an isotropic region followed by two blue phases, which both are rather blue-colored, and finally, a phase transition to the cholesteric phase. The driving force behind this behavior is a decreasing concentration of the chiral dopant / a decrease of chirality.
In conclusion, this kind of micrograph shows that liquid crystals are one of Nature’s beautiful ways to draw a phase diagram.

Dimensions of the image: ≈ 360x240 µm.
Chiral nematic liquid crystal used: RO-TN-403/CB15 (70/30 %vol).


Jury comment: anisotropic moonlight